Reconnaissance in the Age of AI: Exploring Modern ML Infrastructure
Vulnerability Assessment and Penetration Testing (VAPT)

Executive Summary
Modern AI infrastructure introduces a completely different reconnaissance landscape from traditional applications. Instead of simple web servers and databases, AI environments expose inference servers, vector databases, orchestration platforms, model registries, notebook environments, and GPU-backed services.
Resecurity warns about ongoing malicious activity originating from foreign adversaries probing national AI infrastructure worldwide. These adversaries aim to map exposed AI and ML instances to specific organizations and execute data breaches by exploiting misconfigured services.
This guide covers:
- AI infrastructure components
- AI service fingerprinting
- MLflow and vector database enumeration
- gRPC reconnaissance
- Metrics and metadata leakage
- Jupyter notebook exposure
- AI attack surface mapping
- Supply chain reconnaissance
- AI-focused pentesting methodology
One of the biggest differences in AI environments is the amount of operational intelligence exposed through APIs, metrics, metadata, and orchestration systems. Gaining unauthorized access to such environments can lead to massive data breaches, exposing records stored in data lakes, datasets used for training, and even operator queries, which may reveal confidential and proprietary information.
Introduction to AI Reconnaissance
AI Reconnaissance is the process of identifying, fingerprinting, and analyzing artificial intelligence infrastructure to map the attack surface of modern machine learning environments.
Unlike traditional reconnaissance, AI reconnaissance focuses on discovering:
- Inference servers
- Vector databases
- Model registries
- AI orchestration platforms
- Notebook environments
- GPU-backed infrastructure
It combines automation, machine learning awareness, and security reconnaissance techniques to collect and correlate intelligence at scale.
Understanding the Modern AI Attack Surface
Now that we understand what AI reconnaissance is, the next step is learning how modern AI infrastructure operates in production environments. This is where many traditional security assumptions begin to fail.
In a conventional network assessment, the landscape is predictable:
- Web servers on ports 80 and 443
- SSH on port 22
- MySQL on 3306
- PostgreSQL on 5432
Security professionals have spent years building tools, workflows, and intuition around these patterns.
Why Attackers Care About AI Infrastructure
Modern AI infrastructure contains far more than machine learning models. It often includes sensitive datasets, cloud credentials, internal APIs, orchestration systems, GPU resources, and business-critical automation pipelines.
For attackers, AI environments represent a high-value target because compromising a single AI component can expose an organisation’s entire machine learning ecosystem.
Common attacker objectives include:
- Model theft and intellectual property extraction
- Dataset theft and sensitive information exposure
- GPU hijacking for cryptomining or unauthorized AI workloads
- Supply chain poisoning through malicious models or dependencies
- RAG manipulation and vector database tampering
- Cloud credential theft from notebook environments
- Access to internal Kubernetes or orchestration infrastructure
- Operational intelligence gathering through metrics and metadata leakage
Unlike traditional applications, AI systems are highly interconnected. An exposed notebook, orchestration platform, or model registry may provide visibility into storage systems, inference servers, vector databases, and deployment pipelines simultaneously.
Core Components of AI Infrastructure
A production AI deployment is not a single application or server. It is an interconnected collection of specialised systems that manage different stages of the machine learning lifecycle:
- Data ingestion
- Model training
- Experiment tracking
- Inference serving
- Vector search
- Orchestration
- Monitoring
- Artifact storage
Understanding these components is the foundation of effective AI reconnaissance.
1. Model Serving Endpoints
Model serving frameworks are the operational layer of machine learning systems. Their job is to load trained models into memory and expose prediction APIs that applications can query in real time.
These services are effectively the “front door” of AI deployments.
Unlike traditional web applications, model servers often expose:
- Multiple protocols simultaneously
- Binary streaming interfaces
- GPU metrics
- Internal management APIs
- Model metadata endpoints
This creates a much larger reconnaissance surface than standard REST applications.
1.1 NVIDIA Triton Inference Server
One of the most common enterprise inference frameworks is NVIDIA Triton Inference Server.
Typical exposed ports include:
| Service | Port |
| HTTP API | 8000 |
| gRPC API | 8001 |
| Prometheus Metrics | 8002 |
Three separate interfaces for a single AI service.
During reconnaissance, this matters because each interface exposes different information:
- The HTTP API handles prediction requests
- gRPC supports high-performance internal communication
- Prometheus metrics reveal operational telemetry
An attacker can often map the AI deployment architecture without ever interacting with the actual inference API.
1.2 TensorFlow Serving
TensorFlow Serving is widely used in production ML environments.
Default ports:
- gRPC → 8500
- REST API → 8501
TensorFlow Serving deployments frequently expose model versioning information, prediction schemas, and inference signatures that can help fingerprint the organisation’s ML capabilities.
1.3 TorchServe
TorchServe powers many PyTorch deployments.
Typical configuration:
| Service | Port |
| Inference API | 8080 |
| Management API | 8081 |
| Metrics Endpoint | 8082 |
The management API is especially valuable during reconnaissance because it may expose:
- Loaded models
- Deployment status
- Worker configurations
- Scaling parameters
- Snapshot information
Misconfigured management endpoints can sometimes allow remote model registration or unloading operations.
1.4 LLM-Specific Infrastructure
Large Language Model deployments introduce another layer of specialised infrastructure.
1.5 Ollama
Ollama commonly runs on: Port 11434
It provides lightweight local LLM serving and exposes OpenAI-compatible APIs.
1.6 vLLM
vLLM deployments typically use: Port 8000
vLLM is designed for high-throughput inference and efficient GPU memory management for transformer-based models.
2. AI Orchestration and Experiment Tracking
Orchestration and experiment tracking platforms manage the entire machine learning lifecycle, from model training to deployment. These systems are some of the highest-value targets during AI reconnaissance because they centralise critical information about an organisation’s AI operations.
They commonly store:
- Training experiments
- Hyperparameter configurations
- Model artifacts
- Deployment stages
- Pipeline definitions
- Infrastructure metadata
2.1 MLflow Tracking Server
MLflow commonly runs on:Port 5000
It records:
- Experiment runs
- Training metrics
- Hyperparameters
- Model versions
- Artifact storage locations
Finding an exposed MLflow instance can provide visibility into:
- Proprietary AI projects
- Dataset references
- Cloud storage paths
- Internal model names
2.2 Kubeflow
Kubeflow typically operates over:
- Ports 80 / 443
Built on Kubernetes, Kubeflow orchestrates:
- Training pipelines
- Notebook servers
- Distributed workloads
- Model deployments
Because it integrates deeply with Kubernetes infrastructure, exposed Kubeflow environments
2.3 Ray Framework
Ray commonly exposes:
- Dashboard → 8265
- Serving Endpoint → 8000
The Ray dashboard provides operational visibility into distributed AI clusters, including:
- Active jobs
- GPU allocation
- Worker nodes
- Runtime environments
The ShadowRay campaign specifically targeted exposed Ray dashboards, demonstrating how dangerous publicly accessible AI orchestration systems can become.
3. Vector Databases
Vector databases are a core component of modern AI systems, especially Retrieval-Augmented Generation (RAG) pipelines. They store embeddings — numerical representations of documents, images, or text — that allow AI systems to perform semantic search instead of simple keyword matching.
If an organisation operates:
- AI chatbots
- Knowledge assistants
- Semantic search systems
- Internal AI copilots
There is almost certainly a vector database behind it.
Unlike traditional databases, vector databases are designed to search by similarity, helping AI systems retrieve contextually relevant information for large language models.
Common Vector Databases
Several vector databases appear frequently during AI reconnaissance:
| Platform | Common Ports |
| Qdrant | 6333 (HTTP), 6334 (gRPC) |
| Weaviate | 8080 |
| Milvus | 19530 |
| Chroma | 8000 |
Some platforms, such as Weaviate, also expose GraphQL APIs that provide additional schema visibility.
4. Model Registries and Artifact Management
Model registries store the actual machine learning models used across an organisation’s AI infrastructure. These systems manage model lifecycle operations, version control, deployment stages, and artifact storage.
A registry typically contains:
- Serialized model files
- Version history
- Deployment status
- Artifact locations
- Metadata about model creation and ownership
Common model formats include:
- .pkl
- .pt
- .onnx
- .mar
In production environments, model registries act as the central inventory for an organisation’s AI assets.
5. supporting AI Infrastructure
Beyond model servers and orchestration platforms, AI environments rely heavily on supporting infrastructure that is frequently overlooked during security assessments. These systems often expose sensitive operational data, credentials, and internal architecture details.
In many cases, supporting services become easier reconnaissance targets than the AI models themselves.
5.1 Jupyter Notebook Environments
Jupyter notebooks commonly run on: Port 8888
They are widely used by data scientists for:
- Model development
- Data analysis
- Experimentation
- Internal testing
However, notebooks are frequently misconfigured.
A common issue is running Jupyter with:
--ip=0.0.0.0
without proper authentication enabled.
This can provide anyone who reaches the port with:
- Interactive notebook access
- Terminal access
- Python execution
- Internal network visibility
In many environments, notebook cells also contain:
- Cleartext credentials
- API keys
- Cloud access tokens
- Database connection strings
Because notebooks are designed for convenience rather than security, they often become one of the weakest points in AI infrastructure.
5.2 MinIO Object Storage
MinIO commonly runs on:
- Port 9000
- Port 9001
It provides S3-compatible object storage used for:
- Model artifacts
- Training datasets
- Experiment outputs
- Checkpoints
- Deployment packages
During reconnaissance, exposed MinIO instances may reveal:
- Bucket names
- Artifact structures
- Internal project identifiers
- Stored model files
Because MinIO often stores the actual artifacts powering AI systems, exposure can lead to significant data leakage.
5.3 Prometheus Metrics Endpoints
Many AI model servers expose Prometheus metrics endpoints for monitoring and observability.
Examples include:
- NVIDIA Triton → Port 8002
- TorchServe → Port 8082
AI Infrastructure Port & Protocol Reference
The following reference table covers the most common AI infrastructure components encountered during reconnaissance. These services often expose non-standard ports, gRPC interfaces, metrics endpoints, and AI-specific APIs that traditional scanners may overlook.
| Component | Default Port(s) | Protocol(s) | Common Recon Endpoints |
| NVIDIA Triton Inference Server | 8000, 8001, 8002 | HTTP, gRPC, Prometheus | /v2/models, /v2/health/live, /metrics |
| TensorFlow Serving | 8500, 8501 | gRPC, HTTP/REST | /v1/models, /metadata |
| TorchServe | 8080, 8081, 8082 | HTTP, Management API, Metrics | /models, /metrics, /ping |
| Ollama | 11434 | HTTP | /api/tags, /api/generate |
| vLLM | 8000 | HTTP/OpenAI-Compatible API | /v1/models, /v1/chat/completions |
| Open WebUI | 3000 | HTTP | /api/models, /login |
| LM Studio Server | 1234 | HTTP | /v1/models |
| Text Generation Inference (TGI) | 3000 | HTTP | /generate, /health |
| MLflow Tracking Server | 5000 | HTTP | /api/2.0/mlflow/experiments/list |
| Kubeflow | 80, 443 | HTTP/HTTPS | Dashboard UI, Pipelines UI |
| Ray Dashboard | 8265 | HTTP | /api/jobs, /nodes, /logical/actors |
| Airflow (ML Pipelines) | 8080 | HTTP | /admin, /api/v1/dags |
| Prefect | 4200 | HTTP | /api, Dashboard |
| Qdrant | 6333, 6334 | HTTP, gRPC | /collections, /metrics |
| Weaviate | 8080 | HTTP, GraphQL | /v1/schema, /v1/meta |
| Milvus | 19530 | gRPC | Collection APIs |
| Chroma | 8000 | HTTP | /api/v1/collections |
| Pinecone Gateway | 443 | HTTPS | Index APIs |
| Redis Vector Store | 6379 | RESP/TCP | Key Enumeration |
| Elasticsearch (Vector Search) | 9200 | HTTP | /_cat/indices, /_search |
| Jupyter Notebook | 8888 | HTTP | /tree, /lab, /terminals |
| JupyterHub | 8000 | HTTP | /hub/login |
| VS Code Server | 8080, 8443 | HTTP | /login, /static |
| MinIO | 9000, 9001 | HTTP | /minio, Bucket Listings |
| S3-Compatible Storage | 443 | HTTPS | Bucket Enumeration |
| Prometheus | 9090 | HTTP | /metrics, /targets |
| Grafana | 3000 | HTTP | /login, /api/search |
| NVIDIA DCGM Exporter | 9400 | HTTP | /metrics |
| Kubernetes API Server | 6443 | HTTPS | /api, /version |
| Kubelet API | 10250 | HTTPS | /pods, /metrics |
| Docker Remote API | 2375, 2376 | HTTP/HTTPS | /containers/json |
| RabbitMQ | 15672 | HTTP | /api/overview |
| Kafka | 9092 | TCP | Broker Enumeration |
| Neo4j | 7474, 7687 | HTTP, Bolt | /browser, Cypher Queries |
| Apache Spark UI | 4040 | HTTP | /jobs, /stages |
| Hadoop YARN | 8088 | HTTP | /cluster |
| Label Studio | 8080 | HTTP | /projects, /tasks |
| BentoML | 3000 | HTTP | /healthz, /docs |
| FastAPI ML Services | 8000 | HTTP | /docs, /openapi.json |
| Gradio Apps | 7860 | HTTP | /config, /api/predict |
| Streamlit Apps | 8501 | HTTP | /healthz, WebSocket Endpoints |
Fingerprinting AI Services
Identifying AI infrastructure requires a different reconnaissance mindset than traditional web application fingerprinting. Standard enterprise services usually reveal themselves through familiar banners, technologies, and ports. AI systems, however, expose unique behavioural patterns that become obvious once you know what to look for.
Instead of focusing only on open ports, AI reconnaissance relies heavily on:
- HTTP response headers
- JSON response structures
- Error message formatting
- Endpoint naming conventions
- Protocol behaviour
- Metrics exposure
Each AI framework leaves behind distinct fingerprints. Once these patterns are recognised, identifying AI services becomes fast, reliable, and highly accurate.
1. HTTP Header Fingerprinting
HTTP response headers are often the fastest and most reliable way to identify AI infrastructure during reconnaissance. Many AI inference frameworks unintentionally reveal their identity unless administrators specifically hide them behind reverse proxies or API gateways.
Unlike traditional web applications, AI services frequently expose framework-specific headers, telemetry data, and inference-related metadata that make fingerprinting straightforward.
1.1 TorchServe
TorchServe commonly returns a response header such as:
Server: TorchServe/0.x.x
This is a direct identification of a PyTorch serving environment with little ambiguity.
Combined with endpoints like:
- /models
- /predictions
- /metrics
TorchServe becomes easy to fingerprint during reconnaissance.
1.2 NVIDIA Triton Inference Server
Triton Inference Server exposes one of the most distinctive fingerprints in AI infrastructure.
A common indicator is the presence of:
- NV-Status response headers
Triton also supports a unique request header:
endpoint-load-metrics-format: text
When this header is sent, Triton may return:
- CPU utilisation
- GPU utilisation
- Load metrics
- Hardware telemetry
1.3 FastAPI-Based ML Services
Many custom AI APIs are built using FastAPI and commonly return:
server: uvicorn
On its own, uvicorn only indicates a Python ASGI server. However, when combined with AI-related routes such as:
- /predict
- /embeddings
- /generate
it strongly suggests a machine learning backend.
FastAPI services also frequently expose:
- /docs
- /openapi.json
which may reveal the full API schema during reconnaissance.
1.4 OpenAI-Compatible APIs
Modern LLM serving frameworks often imitate the OpenAI API specification for compatibility with existing tools and applications.
Frameworks such as:
- Ollama
- vLLM
- LiteLLM
commonly expose:
- /v1/models
- /v1/chat/completions
and return:
- x-request-id headers
- Structured OpenAI-style JSON responses
Example response structure:
{"object": "model"}
This is a strong fingerprint of an OpenAI-compatible inference service.
2. API Response Signatures
AI frameworks often reveal their identity through the structure of their API responses. Even when headers are hidden or proxy servers are used, the JSON format itself can act as a reliable fingerprint.
Once you become familiar with common response patterns, identifying AI services from the response body alone becomes straightforward.
2.1 TensorFlow Serving
TensorFlow Serving commonly returns responses such as:
{"model_version_status": [
    {
      "version": "1",
      "state": "AVAILABLE" }]}
The presence of:
- model_version_status
- state
- version tracking fields
is a strong indicator of the TensorFlow Serving infrastructure.
2.2 NVIDIA Triton Inference Server
Triton responses often include detailed model metadata:
{  "name": "fraud_detector",
  "versions": ["1"],
  "platform": "tensorflow_graphdef"}
Common Triton indicators include:
- platform
- versions
- model backend identifiers
- tensor configuration metadata
These fields help identify both the inference server and the underlying ML framework.
2.3 MLflow Error Responses
Even error messages can fingerprint AI infrastructure.
MLflow frequently exposes stack traces referencing namespaces such as:
- mlflow.server
- mlflow.tracking
This means that even failed requests may reveal:
- The orchestration platform
- Backend technologies
- Internal application structure
In many AI environments, verbose error handling unintentionally becomes a reconnaissance source.
2.4 OpenAI-Compatible APIs
LLM-serving frameworks that mimic the OpenAI API format typically return structured responses like:
{"object": "model",
  "id": "llama-3.1-8b",
  "created": 1700000000}
The presence of:
- "object": "model"
- model identifiers
- OpenAI-style schemas
strongly indicates an OpenAI-compatible service.
This usually narrows the technology stack down to:
- vLLM
- LiteLLM
- Ollama
- Custom OpenAI wrappers
3. Error Message Fingerprinting
Error message fingerprinting is one of the most reliable techniques for identifying AI infrastructure during reconnaissance. Unlike traditional web applications, AI inference systems are highly sensitive to input structure, tensor shapes, and data types.
Most AI APIs expect very specific payload formats. When they receive malformed input, they often return verbose debugging information that reveals exactly which framework is running behind the service.
The technique is simple:
Send an intentionally malformed request and analyze the error response.
3.1 TensorFlow Serving
TensorFlow Serving produces highly recognizable validation errors.
For example, sending an invalid tensor payload may trigger responses referencing:
tensorinfo_map
This string is strongly associated with TensorFlow Serving internals and immediately identifies the backend framework.
Tensor-related validation messages may also reveal:
- Expected tensor shapes
- Input dimensions
- Datatypes
- Model signatures
3.2 MLflow
MLflow error responses frequently expose internal namespaces such as:
- mlflow.server
- mlflow.tracking
- databricks
Even failed requests can reveal:
- Backend architecture
- File paths
- Internal modules
- Deployment structure
Certain vulnerabilities, such as historical MLflow path traversal issues, have also exposed full filesystem paths during error handling.
3.3 Databricks Mosaic AI
Databricks Mosaic AI deployments may return Java exception traces like:
io.jsonwebtoken.IncorrectClaimException
This is an immediate fingerprint of a Java-based authentication backend associated with Databricks infrastructure.
These stack traces often expose:
- Framework dependencies
- Authentication libraries
- Internal implementation details
4. Endpoint Naming Conventions
One of the most overlooked reconnaissance techniques in AI infrastructure is endpoint naming analysis. While traditional web applications usually follow predictable REST design patterns, AI systems expose entirely different API structures that immediately stand out once you know what to look for.
Conventional APIs typically use resource-based endpoints such as:
- /users
- /accounts
- /products
- /orders
AI frameworks rarely follow this pattern.
Instead, machine learning services expose action-oriented endpoints focused on inference, generation, embeddings, and model execution. These routes are often highly distinctive and can reveal the presence of AI infrastructure even when banners, headers, and metadata are hidden.
For reconnaissance professionals, endpoint naming conventions become a powerful fingerprinting mechanism during directory enumeration and content discovery.
4.1 AI Inference Endpoints
Inference APIs commonly expose endpoints such as:
/predict
/infer
/generate
/embeddings
/score
/invocations
Unlike traditional REST APIs, these routes describe computational actions rather than resources.
Each endpoint often corresponds to a specific AI capability:
- /predict → Classification or regression inference
- /generate → Text or image generation
- /embeddings → Vector embedding creation
- /score → Model scoring or ranking
- /infer → Generic inference execution
The /invocations endpoint is particularly important because it is strongly associated with Amazon SageMaker deployments.
Finding one of these paths during brute-forcing may indicate machine learning infrastructure. Finding several together almost certainly confirms it.
4.2 Model Management APIs
Many AI serving frameworks expose model inventory and management endpoints through highly predictable paths:
/v1/models
/v2/models
These endpoints are commonly associated with:
- NVIDIA Triton
- TensorFlow Serving
- vLLM
- OpenAI-compatible APIs
- Custom inference gateways
Depending on configuration, these routes may reveal:
- Loaded model names
- Available versions
- Backend frameworks
- Deployment status
- Inference capabilities
In some environments, simply querying the model endpoint provides a complete inventory of deployed AI systems.
4.3 OpenAI-Compatible Endpoint Patterns
Modern LLM-serving frameworks increasingly emulate the OpenAI API specification because it simplifies integration with existing tooling and applications.
Common endpoints include:
/v1/chat/completions
/v1/completions
/v1/embeddings
/v1/models
These routes are commonly exposed by:
- Ollama
- vLLM
- LiteLLM
- Open WebUI
- Custom LLM wrappers
Even if the backend framework is hidden, OpenAI-style endpoint structures strongly indicate the presence of an LLM inference service.
4.4 MLflow API Fingerprinting
MLflow exposes one of the most distinctive API namespaces in AI infrastructure:
/api/2.0/mlflow/
This prefix is highly recognizable and rarely appears outside MLflow deployments.
Its presence typically indicates:
- Experiment tracking systems
- Model registries
- AI orchestration platforms
- Artifact management infrastructure
Because MLflow centralises training metrics, model artifacts, and deployment history, discovering this endpoint during reconnaissance is often extremely valuable.
4.5 Kubeflow Pipeline APIs
Kubeflow deployments expose their orchestration functionality through recognizable pipeline routes such as:
/pipeline/apis/v1beta1/
These endpoints may reveal:
- Training pipelines
- Workflow definitions
- Experiment orchestration
- Kubernetes-integrated AI infrastructure
In enterprise environments, Kubeflow often acts as the operational layer coordinating the organisation’s entire machine learning workflow.
5. gRPC Fingerprinting
Many modern AI frameworks expose gRPC services alongside traditional HTTP APIs. These gRPC interfaces are heavily used for internal communication because they provide faster, low-latency data transfer for tensor-based workloads.
Common examples include:
| Framework | Default gRPC Port |
| NVIDIA Triton Inference Server | 8001 |
| TensorFlow Serving | 8500 |
Unlike REST APIs, gRPC uses binary protobuf communication over HTTP/2. Because of this, traditional HTTP scanners often fail to detect or correctly fingerprint these services.
A normal HTTP probe may return:
- Empty responses
- Protocol errors
- Unknown services
even when a fully functional AI inference API is running behind the port.
Using grpcurl
The primary reconnaissance tool for gRPC services is:
grpcurl
If gRPC reflection is enabled — which is common in development environments pushed into production without hardening — researchers can enumerate the exposed protobuf schema.
Example:
grpcurl -plaintext target:8001 list
This lists all available RPC services exposed by the server.
Detailed service descriptions can then be retrieved:
grpcurl -plaintext target:8001 describe inference.GRPCInferenceService
Enabled gRPC reflection may expose:
- RPC method names
- Service definitions
- Input tensor structures
- Output schemas
- Datatypes
- Inference formats
6. TLS Fingerprinting (JA3/JA4)
AI infrastructure can also be identified at the network level through TLS fingerprinting techniques such as JA3 and JA4.
Unlike traditional web traffic, AI environments generate large amounts of automated service-to-service communication using:
- Python libraries
- gRPC clients
- ML orchestration tools
- API automation frameworks
This traffic behaves very differently from normal browser-based activity.
What JA3 and JA4 Measure
JA3 and JA4 create fingerprints based on TLS handshake characteristics, including:
- Cipher suites
- TLS extensions
- Protocol versions
- Client negotiation behaviour
Enumerating AI Systems
Once you have identified the framework behind an AI service, the next step is enumeration — extracting as much information as possible from exposed APIs, metadata endpoints, and management interfaces.
This is where AI reconnaissance becomes significantly more valuable.
Fingerprinting answers:
“What is this service?”
Enumeration answers:
In many AI environments, enumeration exposes far more intelligence than traditional infrastructure reconnaissance.
From Identification to Intelligence
Fingerprinting may tell you:
This is an MLflow server.
Enumeration may reveal:
- 12 active experiments
- 5 production LLM models
- Artifact storage paths
- Internal project names
- GPU training configurations
- Deployment environments
For example:
s3://nova-ai-prod-models/
Created by: Sarah.Kim (ML Engineer)
Project: customer-support-rag
Model: llama3-support-assistant-v2
Stage: Production
At this point, reconnaissance moves beyond service discovery and starts exposing the organisation’s internal AI operations.
1. MLflow Enumeration
MLflow is one of the most valuable targets during AI reconnaissance because it centralises nearly every part of the machine learning lifecycle and exposes it through a structured REST API.
If an MLflow instance is publicly accessible, a small number of API requests can reveal:
- Experiments
- Models
- Artifact locations
- Training metrics
- Deployment stages
- Internal project names
- User attribution metadata
In many environments, enumerating MLflow effectively maps the organisation’s entire AI portfolio.
Step 1: Enumerate Experiments
MLflow experiments can be listed through:
POST /api/2.0/mlflow/experiments/search
The response typically includes:
- Experiment names
- Experiment IDs
- Creation metadata
Experiment names often reveal internal projects and business functions.
Example:
fraud-detection-v3
customer-support-rag
internal-risk-scoring
llm-finetune-testing
Even experiment naming conventions alone can expose valuable operational intelligence.
Step 2: Enumerate Registered Models
Model inventories can be retrieved through:
GET /api/2.0/mlflow/registered-models/list
This endpoint may reveal:
- Registered model names
- Descriptions
- Creation timestamps
- Deployment stages
Example:
Model: finance-forecast-transformer
Stage: Production
Created: 2026-02-18
At this stage, researchers can begin mapping the organisation’s active AI systems.
Step 3: Retrieve Model Version Metadata
Detailed version information can be queried through:
GET /api/2.0/mlflow/model-versions/search
This is often the most valuable enumeration step.
Responses may include:
- Artifact URIs
- Cloud storage paths
- Version history
- User attribution
- Deployment stages
Example:
Source: s3://nova-ai-models/experiments/4/artifacts/
User: emily.chen
Stage: Production
Artifact paths frequently expose:
- S3 bucket names
- Internal storage structure
- Model artifact locations
This provides visibility into both infrastructure and deployment architecture.
Step 4: Search Training Runs
Training run metadata can be queried through:
POST /api/2.0/mlflow/runs/search
This may reveal:
- Hyperparameters
- Accuracy metrics
- Training configurations
- GPU usage
- Custom tags
Tags are especially valuable because teams often store:
- Internal codenames
- Git commit hashes
- Environment identifiers
- Deployment labels
Example:
env=production-gpu
git_commit=4f2c9ab
team=fraud-analytics
These details can help correlate AI infrastructure with internal development workflows.
Step 5: Enumerate Artifacts
Artifact listings can be retrieved through:
GET /api/2.0/mlflow/artifacts/list
This endpoint may expose downloadable artifacts such as:
- Serialized models
- Training outputs
- Checkpoints
- Configuration files
Example:
model.pkl
tokenizer.json
training_config.yaml
At this point, the organisation’s machine learning environment has effectively been mapped through a small number of API calls.
2. Inference Server Metadata
AI inference servers often expose metadata endpoints that reveal exactly how deployed models operate. These endpoints are designed to help developers integrate applications with machine learning models, but during reconnaissance they become an extremely valuable intelligence source.
Frameworks such as:
- NVIDIA Triton Inference Server
- TensorFlow Serving
provide detailed model configuration data through publicly accessible APIs.
In many cases, these endpoints expose enough information to fully reconstruct valid inference requests without needing documentation or source code.
Triton Model Configuration Enumeration
Triton exposes detailed model metadata through:
GET /v2/models/<name>/config
The response commonly includes:
- Input tensor names
- Tensor shapes
- Datatypes
- Batch size limits
- Backend framework information
Example fields may include:
- FP32
- UINT64
- INT8
- tensorflow_graphdef
- pytorch_libtorch
- onnxruntime
This effectively provides a blueprint for interacting with the model.
TensorFlow Serving Metadata
TensorFlow Serving exposes similar functionality through:
GET /v1/models/<name>/metadata
These responses may reveal:
- Input tensor names
- Output tensor names
- Expected shapes
- Datatypes
- Model signatures
Example metadata often includes:
- Tensor dimensions
- Float and integer types
- Prediction output structures
This allows researchers to understand precisely how the inference API expects requests to be constructed.
3. Vector Database Enumeration
Vector databases are one of the most valuable reconnaissance targets in modern AI environments because they reveal what data an AI system is built around and which embedding models power its semantic search capabilities.
These databases are commonly used in:
- RAG pipelines
- AI assistants
- Enterprise search systems
- Chatbots
- Knowledge retrieval platforms
Unlike traditional databases, vector stores expose metadata about embeddings, collections, and indexing structures that can reveal significant operational intelligence.
3.1 Weaviate Enumeration
Weaviate exposes several useful reconnaissance endpoints.
Server metadata can be retrieved through:
GET /v1/meta
This may reveal:
- Server version
- Installed modules
- Backend configuration
- Enabled vectorisation components
Schema enumeration is available through:
GET /v1/schema
This endpoint returns:
- Class definitions
- Property names
- Data structures
- Vectoriser configuration
The vectoriser field is especially important because it identifies which embedding model or embedding provider the system uses.
Weaviate also commonly exposes:
/v1/graphql
On unauthenticated deployments, this may allow:
- Schema introspection
- Metadata enumeration
- Data querying
This can provide direct visibility into the organisation’s AI knowledge base.
3.2 Qdrant Enumeration
Qdrant exposes collection information through:
GET /collections
This returns all available collection names.
Detailed collection metadata can then be queried using:
GET /collections/<name>
Responses may reveal:
- Vector dimensions
- Distance metrics
- Point counts
- Collection configuration
For example:
Collection: internal-hr-policies
Vectors: 768 dimensions
Points: 50,000
Even without direct document access, this reveals:
- The likely use case
- The scale of indexed data
- The probable embedding model family
A 768-dimensional embedding size strongly suggests transformer-based embeddings commonly used in RAG systems.
3.3 Chroma Enumeration
Older Chroma deployments frequently exposed:
GET /api/v1/collections
without authentication enabled by default.
This endpoint may reveal:
- Collection inventories
- Internal project names
- AI application structures
- Retrieval system organisation
Because many vector databases prioritize developer usability and rapid deployment, authentication is often weak or entirely absent in development environments pushed to production.
4. Prometheus Metrics as Intelligence
Many AI inference servers expose Prometheus metrics endpoints for monitoring and observability. These endpoints are often available on dedicated ports and provide a surprisingly detailed view into production AI systems.
Common examples include:
| Framework | Metrics Port |
| NVIDIA Triton Inference Server | 8002 |
| TorchServe | 8082 |
These services typically expose: metrics in Prometheus format.
5. Debug Interfaces and Information Leakage
One of the most common weaknesses in AI infrastructure is excessive debugging functionality left enabled in production environments.
AI platforms are heavily optimized for:
- Rapid experimentation
- Developer usability
- Model debugging
- Internal observability
As a result, many frameworks expose interfaces and verbose error handling that unintentionally provide a rich source of reconnaissance data.
In many cases, these leaks reveal more operational intelligence than the primary APIs themselves.
5.1 FastAPI Debug Interfaces
Many custom AI services are built using FastAPI, which automatically generates interactive API documentation endpoints.
Common exposed routes include:
/docs
/openapi.json
These endpoints may reveal:
- Full API schemas
- Request formats
- Response structures
- Authentication requirements
- Example payloads
- Internal endpoint names
For reconnaissance professionals, this is effectively free documentation of the entire inference API.
5.2 MLflow GraphQL Exposure
Some MLflow deployments historically exposed GraphQL functionality through:
/graphql
In certain configurations, GraphQL resolvers could bypass standard REST API authentication controls.
Accessible resolvers may expose:
- Experiment inventories
- Training runs
- User metadata
- Source code paths
- Internal project names
Queries such as:
- mlflowSearchRuns
- mlflowGetRun
Even metadata tags like:
mlflow.source.name
can expose internal development structure and proprietary project organisation.
5.3 Verbose Debug Parameters
AI gateways and inference APIs sometimes expose additional debugging output through parameters such as:
?debug=true
?verbose=1
In poorly hardened environments, these parameters may trigger:
- Raw stack traces
- Filesystem paths
- Installed package versions
- Python exceptions
- Environment variable loading errors
6. Jupyter Notebook Enumeration
Jupyter environments are especially valuable reconnaissance targets because they combine:
- Interactive code execution
- Development workflows
- Infrastructure access
- Credential storage
On exposed Jupyter instances, endpoints such as:
GET /api/kernels
may reveal:
- Active kernel IDs
- Notebook activity timestamps
- Running sessions
- Execution state
Even this metadata can help infer:
- Which notebooks are actively used
- What workloads are running
- Which users are connected
Credential Leakage in Notebook Cells
The real value of exposed Jupyter environments is often inside the notebook content itself.
Data scientists frequently store credentials directly in notebook cells for convenience, including:
- MLflow credentials
- Cloud storage access keys
- API tokens
- Database passwords
- Hugging Face tokens
Examples commonly encountered include:
- MLFLOW_TRACKING_USERNAME
- MLFLOW_TRACKING_PASSWORD
- AWS access keys
- Hugging Face API tokens
Because notebooks are designed for experimentation rather than security, secrets management practices are often weak.
Mapping the AI Attack Surface
At this stage of reconnaissance, you have already:
- Identified AI components on the network
- Fingerprinted the frameworks behind them
- Enumerated APIs and metadata
- Extracted operational intelligence
Those are individual findings.
The next step is turning those isolated findings into a complete attack surface map.
This is where reconnaissance becomes significantly more powerful.
From Individual Findings to Infrastructure Mapping
A single exposed MLflow server is useful.
But the real value comes from understanding how that MLflow instance connects to:
- Model registries
- Object storage
- Inference servers
- Vector databases
- Notebook environments
- Kubernetes clusters
- GPU-backed workloads
The difference between a vulnerability list and a true AI attack surface map is the relationships between components.
For example:
MLflow → S3 Artifact Storage → Triton Inference Server → Vector Database → Internal RAG Assistant
Once these connections are identified, the organisation’s entire machine learning architecture begins to emerge.
How AI Expands the Traditional Attack Surface
Traditional web applications usually expose a relatively small and predictable attack surface:
- HTTP/HTTPS services
- Authentication systems
- Databases
- SSH access
In most environments, that means roughly:
- 4–5 primary exposed ports
- A handful of backend services
- Limited internal service communication
AI Systems Are Built as Service Meshes
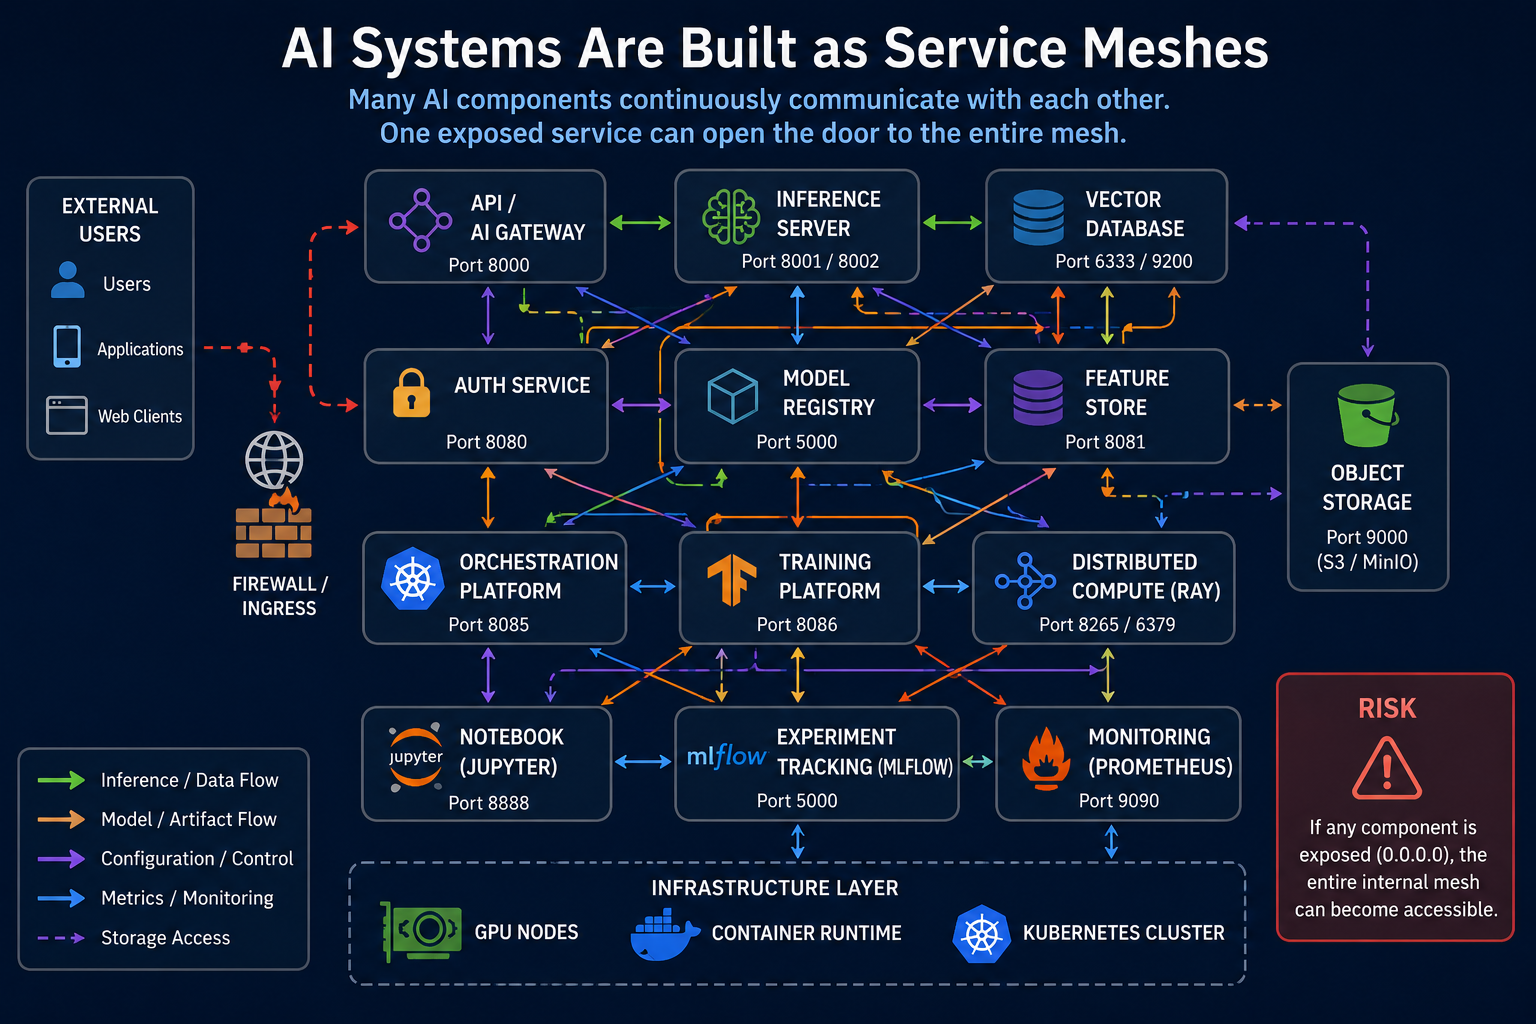
Modern AI environments rely on continuous communication between components.
For example:
- Inference servers query vector databases
- MLflow pushes artifacts to object storage
- Kubeflow orchestrates training pipelines
- Ray distributes workloads across clusters
- Jupyter notebooks connect to every internal service
- Prometheus continuously scrapes metrics from the entire environment
Unlike traditional applications, AI systems are designed around constant high-volume internal communication.
This creates a dense mesh of trusted internal traffic.
At the center of the architecture are the core AI services:
- Inference servers handling model predictions
- Vector databases powering semantic search and RAG pipelines
- Model registries storing trained models and artifacts
- Training platforms and distributed compute clusters processing machine learning workloads
Surrounding these systems are orchestration and operational components such as:
- MLflow experiment tracking
- Kubernetes orchestration platforms
- Jupyter notebook environments
- Prometheus monitoring systems
- Object storage platforms like MinIO or S3
The arrows represent constant internal communication flows:
- Inference requests and embedding lookups
- Model artifact transfers
- Metrics collection and monitoring
- Configuration synchronization
- Storage access between services
One Weak Service Can Expose Everything
In many AI deployments, internal services assume they are operating inside a trusted environment.
As a result:
- Authentication is weak or missing
- Internal APIs are openly accessible
- Metrics endpoints are unauthenticated
- gRPC services trust internal traffic
- Notebook environments have broad access
If even one component accidentally binds to:
0.0.0.0
instead of:
127.0.0.1
the entire internal AI mesh may become externally reachable.
This is one of the biggest differences between traditional infrastructure and AI environments:
Internal exposure quickly becomes external exposure.
Platform Misconfigurations That Attackers Map
The most dangerous AI exposures are often not advanced zero-days or novel attacks. They are routine deployment mistakes repeated across thousands of environments.
Modern AI platforms prioritize:
- Rapid experimentation
- Ease of deployment
- Developer convenience
- Internal collaboration
Security hardening frequently comes later — if it happens at all.
As a result, many AI services are deployed with:
- Weak authentication
- Exposed management interfaces
- Overly permissive network access
- Dangerous default configurations
For reconnaissance professionals, these misconfigurations become high-value mapping targets.
1. MLflow Misconfigurations
MLflow historically shipped without authentication enabled by default before version 2.x.
This meant that publicly exposed MLflow instances often provided unrestricted access to:
- Experiments
- Model registries
- Artifact metadata
- Training runs
- Internal project information
Even after authentication support was introduced, additional security issues emerged.
One vulnerability exposed the risk of default credentials stored inside:basic_auth.ini
This allowed attackers scanning: Port 5000
to authenticate using predictable or hardcoded credentials in improperly configured environments.
Additional vulnerabilities in artifact handling mechanisms demonstrated how unsafe file operations inside ML workflows could escalate from information disclosure into remote code execution.
The key lesson is that AI orchestration systems frequently combine:
- Sensitive metadata
- Artifact management
- File handling
- Execution pipelines
inside a single platform.
2. Kubeflow Dashboard Exposure
Kubeflow deployments are commonly exposed through:
- Kubernetes LoadBalancers
- NodePorts
- Public ingress controllers
In many environments, authentication mechanisms such as:
- OIDC
- Identity-aware proxies
- RBAC restrictions
are disabled or incompletely configured.
An exposed Kubeflow dashboard may allow attackers to:
- View pipelines
- Access notebook environments
- Launch workloads
- Interact with Kubernetes-connected services
The most dangerous part is often the notebook integration.
Notebook servers frequently inherit:
- Kubernetes service accounts
- Cluster permissions
- Access to internal APIs
This creates a direct path from:
Exposed dashboard → Notebook access → Kubernetes infrastructure
In AI environments, orchestration exposure often becomes infrastructure exposure.
3. TorchServe Management API
TorchServe exposes a management API by default on:
- Port 8081
This interface supports:
- Dynamic model registration
- Model loading
- Model unloading
- Worker management
If publicly accessible, the server may be instructed to:
- Download external model archives
- Register arbitrary .mar files
- Load attacker-controlled models
TorchServe executes initialization code during model loading.
This means that loading a malicious model archive can lead to:
- Arbitrary code execution
- Server compromise
- Internal network access
4. SageMaker Notebook Exposure
Cloud-hosted notebook environments introduce another major attack surface.
Amazon SageMaker notebooks configured with:
DirectInternetAccess: Enabled
may accept inbound internet connections depending on surrounding network policy configuration.
These notebook environments commonly contain:
- Training code
- Cloud credentials
- API tokens
- Access to internal ML systems
Because notebooks are designed for convenience and collaboration, they are often deployed with broad access permissions.
A single exposed notebook can become an entry point into:
- Object storage
- Model registries
- Training infrastructure
- Cloud orchestration systems
Supply Chain Reconnaissance
Modern AI systems depend heavily on external platforms, third-party packages, pretrained models, and cloud-hosted datasets. These dependencies create a large and often overlooked supply chain attack surface.
During reconnaissance, attackers are not only mapping internal infrastructure — they are also identifying:
- External model sources
- Dependency pipelines
- Package registries
- Access tokens
- CI/CD integrations
- Model distribution workflows
In AI environments, supply chain visibility frequently becomes operational visibility.
Hugging Face Token Exposure
One of the most common findings during AI reconnaissance is exposed Hugging Face access tokens.
These tokens often appear in:
- .env files
- GitHub repositories
- Notebook cells
- CI/CD pipeline logs
- Kubernetes secrets
- Docker build files
Simple GitHub dorks such as:
filename:.env HF_TOKEN
can reveal accidentally exposed credentials.
A compromised Hugging Face token may provide:
- Access to private models
- Dataset downloads
- Model uploads
- Repository modification permissions
Because many organisations store proprietary LLMs and fine-tuned models on Hugging Face, token exposure can directly compromise the AI supply chain.
1. Dependency Confusion in ML Pipelines
Machine learning environments are especially vulnerable to dependency confusion attacks.
ML projects commonly contain large:
- requirements.txt
- environment.yml
- pyproject.toml
files with internal package references.
Example:
company-data-utils
internal-ml-common
corp-feature-engineering
If these internal package names are not registered publicly on:
- PyPI
- npm
- other package registries
an attacker may register malicious versions externally.
This becomes especially dangerous in:
- Kubeflow pipelines
- Automated training jobs
- Dynamic container builds
Where dependencies are installed automatically during runtime.
A malicious package can execute code directly inside:
- Training clusters
- GPU nodes
- CI/CD environments
- Model build pipelines
2. Reconnaissance of Model Download Sources
AI systems frequently download pretrained models from external sources during deployment or training.
Common sources include:
- Hugging Face Hub
- PyTorch Hub
- GitHub releases
- External artifact repositories
These download locations are often visible inside:
- Configuration files
- Notebook cells
- Dockerfiles
- Build logs
- Training scripts
Example:
from_pretrained("company/private-llama-model")
or:
https://huggingface.co/org/model-name
This allows researchers to identify:
- Which external dependencies the organisation trusts
- Which model providers are used
- Which repositories contain production AI assets
AI Reconnaissance Methodology
This methodology provides a structured workflow for identifying, fingerprinting, and enumerating AI infrastructure during security assessments.
Phase 1. Passive Reconnaissance
Before interacting with the target, identify publicly exposed AI infrastructure.
Search Engines
Use:
- Shodan
- Censys
- FOFA
Example queries:
port:5000 "MLflow"
port:8888 title:"Home Page - Select or create a notebook"
http.title:"Ray Dashboard"
GitHub Secret Hunting
Search for leaked AI credentials:
filename:.env MLFLOW_TRACKING_URI
filename:.env HF_TOKEN
filename:config.json model_name
Look for:
- MLflow credentials
- Hugging Face tokens
- Cloud storage keys
- Model configurations
Public Research & Job Posts
Check:
- arXiv papers
- Engineering blogs
- Conference talks
- Job postings
These often reveal:
- Frameworks in use
- AI architecture
- Orchestration platforms
- Infrastructure choices
Phase 2. Active Scanning
Scan common AI infrastructure ports.
Example:
nmap -p 5000,6333,8000,8001,8002,8080,8265,8500,8501,8888,9000,11434,19530 -sV --script=http-title,http-headers <target>
Common targets include:
- MLflow
- Triton
- TensorFlow Serving
- Qdrant
- Ray
- Jupyter
- MinIO
gRPC Enumeration
Check:
- Port 8001
- Port 8500
Phase 3. API Fingerprinting
Run:
- ffuf
- feroxbuster
- dirsearch
with AI-specific endpoints.
Example paths:
/v1/models
/v2/models
/api/2.0/mlflow/
/v1/schema
/openapi.json
/docs
/graphql
/api/kernels
/metrics
For every response:
- Inspect headers
- Parse JSON structure
- Analyze error messages
- Identify framework-specific patterns
Phase 4. Metadata Extraction
Enumerate confirmed AI services.
MLflow
Extract:
- Experiments
- Registered models
- Artifact URIs
- Training runs
- User metadata
Inference Servers
Extract:
- Tensor schemas
- Input/output formats
- Backend frameworks
Vector Databases
Extract:
- Collections
- Embedding dimensions
- Vectoriser configuration
Jupyter
Extract:
- Kernel activity
- Notebook contents
- Stored credentials
Phase 5. Supply Chain Review
Review:
- Hugging Face dependencies
- External model downloads
- Package dependencies
- Container registries
Check for:
- Public artifact buckets
- Dependency confusion risks
- Exposed AI tokens
- Public container access
Conclusion
Modern AI infrastructure introduces a much larger and more interconnected attack surface than traditional applications. Instead of isolated web servers and databases, AI environments rely on inference engines, vector databases, orchestration platforms, notebooks, and model registries that continuously communicate with each other.
Throughout this guide, we explored how AI reconnaissance involves fingerprinting frameworks, enumerating APIs, extracting metadata, and mapping relationships between services.
One of the biggest challenges in AI security is the amount of operational intelligence exposed through APIs, metrics, model registries, debug interfaces, and notebook environments. As AI adoption continues to grow, security teams must treat AI infrastructure as a dedicated attack surface that requires specialised reconnaissance techniques and security assessments.
To mitigate the risks of data breaches and AI service misconfigurations, Resecurity assists businesses and government agencies through Vulnerability Assessment and Penetration Testing (VAPT). Conducting timely Red Teaming exercises and implementing Managed Threat Detection adds confidence that your infrastructure is properly protected. These proactive measures help identify and address potential blind spots and vulnerabilities at an early stage, preventing attackers from exploiting them.
